RF Data Analytics: Another Idea Which Time Has Come
The cloudification of Big Data is a major trend. The cloudification of Radio Frequency (RF) data is the next frontier that can enable new fields of big data analytics research, services and applications. “RF data” is defined as data paired with associated metadata (data about data). Data and metadata definitions have been recently specified by the VITA 49 standard. The metadata can be even represented using XML or ontology. The architecture enables various RF data analytics. A first application of the proposed architecture is long-term spectrum monitoring.
by Todor Cooklev and Daniel Bennett
Cloudification and big data techniques have brought text analytics (email, documents), web content (text, image, video), and web usage (browser logs, transactions) analytics. These technologies are based on the processing of huge amounts of data generated by many sensors, instruments, or web applications. The next frontier is the cloudification of RF data.
WHAT IS RF DATA?
Currently RF data is considered to be either time-domain in-phase and quadrature (IQ) data, or frequency-domain (spectrum) data. Even though IQ data is at baseband, not RF, level, it still requires very high sampling rates. For a long time the datafication of RF was not practical. Nevertheless, this has been very desirable and over the years many platforms that produce “digital IQ” have appeared, with generally increasing capabilities. For spectrum data usually only absolute value obtained as a result of long-term averaging is retained and the data rate is much lower.
In general RF spectrum data is generated per nanosecond or even more often and requires a Big Data approach. Continuous RF spectrum monitoring can produce more data than companies such as Facebook ingest. Currently fielded systems try to generate much less data by limiting the performance. In fact, the amount of data produced by spectrum monitoring, dwarfs most other Big Data applications. Current technology is finally capable to begin to answer these challenges.
At first, considering as RF data just “digital IQ” or spectrum data may seem adequate. However, digital IQ data does not convey any knowledge about the RF signal, such as location, RF center frequency. We define RF data as the time-domain IQ data paired with its metadata (data about data) such as RF center frequency, bandwidth, time-stamp, location, precision, sampling frequency, noise figure, signal-to-noise ratio, antenna beamwidth, polarization, etc. Furthermore, both the metadata and the RF signal may have attributes such as current value, average, variance, maximum, minimum, precision, probability, etc. These attributes are also metadata.
In a cloud architecture the time instant a signal is processed (actual time) is different from the time instant an RF signal passes through the antenna (signal time). Therefore the metadata must make this distinction when paired with a signal. This shows that the metadata allows all information about the RF signal impinging on the antenna to be described, i.e. it is an abstraction.
Although some metadata has been defined, wireless is an area that is developing fast. The list of metadata must be extensible to support additional and more sophisticated RF data services. Ultimately, any additional information that could be useful can also be metadata, including information about the RF client, or other known RF devices, spectrum policies, etc. In general, this metadata can be formally represented using powerful formats that are both human-readable and machine-readable such as XML or ontologies.
We refer to radio receivers that produce RF data defined in this way as RF clients. Note that an RF client may transmit metadata packets without corresponding data packets.
CLOUD AND INTERFACE TO THE CLOUD
The area of cloud computing has recently experienced very significant commercial growth. The cloud concept has been transferred to wireless systems.
Cloud architectures for RF are different from computing clouds. A key difference is the interface between the client and the cloud. In computing clouds, this interface is a trivial issue. For spectrum sensors, the interface is not a trivial issue because of the necessity of analog RF hardware.
The ANSI/VITA 49 standard defines RF data and metadata and, therefore can be used as an interface to the cloud. Note that this interface is independent of the specific technique to carry these packets. The actual interface to the cloud may be Ethernet. According to this standard each data packet stream is paired with its corresponding metadata packet stream using a common stream identifier. Ultimately, the metadata is an abstract description of the spectrum sensor, and it allows the signal impinging on the antenna to be described exactly and later reconstructed, if necessary. Simply connecting monitoring clients to a cloud without such a metadata description, as done in current sensing products, cannot achieve any of these advantages.
Note that this interface is open. A similarly fundamental abstraction is the frequency, voltage, and electric plug interface for electrical power. By the same token, as long as RF clients and clouds support an open interface, suitable RF services can be offered, in particular spectrum monitoring software as a service, where the entire hardware and software solution that implements spectrum monitoring is offered as a service. The monitoring software can be implemented as a collection of interacting entities.
This solution is being implemented by Adaptive RF, a recently established start-up company. The solution includes a collaborative platform for RF data analytics. The platform allows the sharing of data, algorithms, and services and a first application is spectrum monitoring. This proposed approach enables the introduction of RF data analytics.
RF CLOUD SERVICES AND RF DATA ANALYTICS
The RF cloud architecture described above allows a number of novel services to be offered. Depending on the needs of the service users, similar to cloud computing, these services range from infrastructure as a service (IaaS), Platform aaS, to Software aaS. Furthermore some services are composite services in the sense that they require the collaboration of RF clients and clouds.
While IaaS, PaaS, and SaaS can be offered, the proposed architecture allows business models beyond the pay-as-you-go business model that is fundamental to cloud computing. The reason is that this RF cloud architecture allows providing not just technology aaS (whether hardware, platform, or software), but the revenue model can also be based on data or outcomes aaS, for example RF spectrum data aaS. Outcomes as a service can include spectrum usage information or abnormal spectral event notification as a service.
Furthermore, this architecture allows more complex services to be offered such as RF data analytics. RF data analytics is the analysis to uncover what is buried in the data by mining massive datasets of RF data at different resolution levels. It must be noted that the process of mining RF data that we consider generally excludes demodulation. Note also that RF time-domain or spectrum data, defined as data paired with any type of metadata, are semi-structured and well-suited to be analyzed by big data techniques. There are two main paradigms for this analysis. One paradigm, provided by MapReduce is batch processing, in which data is first stored, and then analyzed. Streaming is another paradigm which treats the data as a stream of unknown size, and for practical reasons only a limited portion of this stream is stored. While in principle streaming is faster, most applications use the batch-processing paradigm even for real-time data and Hadoop and MapReduce have become the de facto standards for big data platforms.
We consider several types of RF data analytics. Descriptive analytics such as number of connection requests, data sessions, average duration, etc. are the first example. Beyond descriptive analytics we envision predictive analytics and prescriptive analytics. The purpose of predictive analytics is to predict near-term spectrum usage, assisting decision making by devices such as cognitive radios. Longer-term spectrum usage predictions are of interest to entities such as spectrum regulators and spectrum licensees. Finally, prescriptive RF data analytics allows optimization of spectrum usage and is of interest to all stakeholders in the wireless industry. Ultimately, these RF data analytics services help devices, networks, and organizations obtain insights about the RF spectrum and its use in order to make decisions and ultimately gain a competitive advantage.
A first example of descriptive RF data analytics service is spectrum monitoring. Due to the insatiable demand for higher data rates and more spectrum, the spectrum environment has become increasingly complex. Future spectrum allocations will require RF devices to share spectrum. Information about how efficiently is spectrum being used is increasingly required and one-time measurements of spectrum occupancy are clearly inadequate. Spectrum monitoring is a service that is a very good candidate to be offered by RF clouds not only to take advantage of benefits such as elasticity and ability to scale, but also to enable services that are simply otherwise not possible. Using this architecture novel RF data analytics services can be introduced helping to determine how much are wireless systems are using the spectrum that they have been given. In this way monitoring can identify opportunities for spectrum sharing. According to spectrum sharing a radio is allowed to use temporarily unoccupied spectrum (white space) if it knows its location and can access a geolocation database on its own, or use the services of another device that can connect to such a database. The database provides information regarding the spectrum occupied by incumbent (primary systems) operating in the same location and the maximum power levels that could be used in that location without interfering with the incumbents.
We have developed a test cloud-based platform that is collaborative, allowing RF data owners to store, share, and analyze data and data scientists to test the performance of different algorithms. Virtualization ensures that the users of the platform share computing resources, but use the platform in isolation from one another. Furthermore, the platform allows a video of the RF data to be recorded, making an interesting connection between the fields of video monitoring and RF spectrum monitoring. The platform also allows various RF analytics services to be deployed. Figure 2 shows an example, including metadata such as mean and variance, capturing a signal at 462.6 MHz.
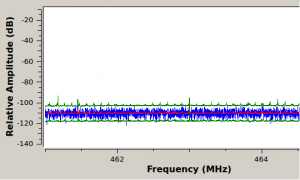
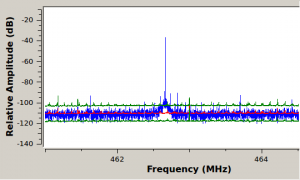
Examples of RF Spectrum Data: background (left) and abnormal spectral event (right). Signal mean is displayed in red, and deviations +/- 2σ from the mean are displayed in green.
Another example of mining the results of spectrum monitoring is shown in Figure 3, capturing activity on Fort Wayne, Indiana’s public safety P25 radio system that includes fire safety, EMS, and law enforcement. This communication is distributed in a 2 MHz band at around 853 MHz. The RF data analytics service is based on pairing the spectrum data with metadata provided by the RF client such as location, duration, channel and time instant, and can use metadata available on the Internet about the P25 radio system in Fort Wayne. As a result, it is capable of identifying emergency situations in the local area.
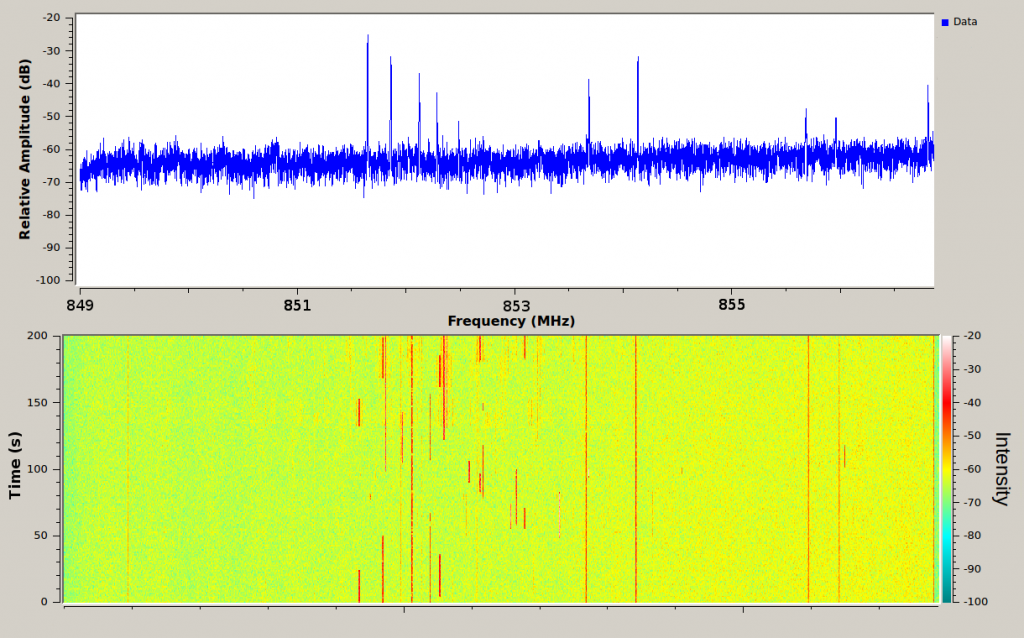
RF spectrum data representing Allen County, Indiana’s Public Safety P25 System in use
CONCLUSIONS
Spectrum is of high – and growing – economic value to consumers, organizations, and governments. We describe an architecture based on an open standard for RF data and metadata. The proposed architecture allows RF applications to be offered from a cloud in a way similar to the delivery of electrical power. Various innovative RF data analytics services that help find useful knowledge from RF data are enabled. A collaborative RF data analytics platform is being developed for this purpose.